分析ダッシュボードでは、キャンペーンのパフォーマンスを分析するための主要な指標を追跡できます。この記事では、ダッシュボードに表示できるさまざまな指標について説明します。
分析ダッシュボードについて
分析ダッシュボードでは、さまざまな分析を実行したり、キャンペーン分析の目標と範囲の定義に適用できる一連のフィルターを使用したりできます。これにより、クリエイティブ、在庫、アドエクスチェンジごとに詳細な洞察を得ることができます。また、コホート分析を実行して、キャンペーンのROASを取得したり、ユーザーの獲得と維持の傾向を把握したりすることもできます。
分析ダッシュボードからのデータのエクスポート
-
画面左上のドロップダウンメニューからアドアカウントを選択します。
-
画面の左側にある [Analytics] をクリックします。分析ダッシュボードが表示されます。
-
[Predefined analytics] では、ドロップダウン・メニューからお好きな分析タイプを選択します。
- [Add filter] をクリックして、分析に適用するデータと条件を指定します。指定が終わったら、[Apply] をクリックします。データは [Overall] セクションと [Daily] セクションに表示されます。
- 列項目をドラッグ・アンド・ドロップして、表示順序を変更できます。
- 各列の名前をクリックすると、データを昇順または降順で並べ替えできます。
- 右上の [CSV] をクリックすると、表示されたデータをダウンロードできます。各ダウンロードには、最長90日間、最大10,000行のデータを含めることができます。
重要: 日付範囲を変更すると、ダッシュボードに表示されるデータは更新された日付範囲から取得されます。指定した日付範囲が長いほど、ダッシュボードに表示されるデータの更新に時間がかかります。
特定の日付範囲のデータを表示およびエクスポートするには、次のデータフィルターの1つまたは複数を適用し、データを取得する日付範囲を指定する必要があります。
分析タイプ
SKAdNetwork分析
重要:SKAdNetworkデータは、SKAdNetwork分析にのみ含まれ、他のタイプの分析では使用できません。
SKAdNetwork分析を実行して、キャンペーン、アトリビューションタイプ、コンバージョン値などのSKAdNetworkデータから洞察を得ることができます。
| 項目 |
説明 |
| Date range |
-
Overall:この表では、指定期間中のすべてのキャンペーンのすべての指標が表示されます。結果は、降順の使用金額で表示されます。
-
Daily:この表では、各キャンペーンのすべての指標の日次内訳が表示されます。結果は、降順の日付と使用金額で表示されます。
|
| Levels |
以下のレベルでデータを表示できます。
| 項目 |
説明 |
| App |
これは、宣伝されているアプリの名前とIDです。 |
| Campaign |
これは、キャンペーンの名前とIDです。 |
| Country |
これは、3桁の国番号です。利用可能なすべての国コードについては、このリストをご覧ください。 |
|
| Metrics |
以下の指標を選択して表示できます。NULL値のみを含む列全体を含めるまたは除外するには、[Show null data] を使用します。
| 項目 |
説明 |
| Date |
これは、指標が記録された日です。タイムゾーンは、アドアカウントのタイムゾーンと同じです。[Daily] が日付範囲の場合、この指標はデフォルトで含まれているので、削除できません。 |
| Spend |
これは、広告費の総額です。 |
| Click |
これは、クリック数の合計です。 |
| Impression |
これは、インプレッション数の合計です。 |
| Install (MMP) |
これは、MMP帰属(アトリビューション)のすべてのインストール数です。 |
| Install (SKAN) |
これは、SKAdNetwork帰属(アトリビューション)のすべてのインストールです。 |
| Action (MMP) |
これは、キャンペーン目標に対して選択されたMMP帰属(アトリビューション)のすべてのイベントの合計です。アプリ内イベント用に最適化されたキャンペーンの場合、これは、アプリ内イベントの最適化ゴールに対するMMP帰属(アトリビューション)のすべてのターゲットイベントの合計です。ROASに最適化されたキャンペーンの場合、これは、MMP帰属(アトリビューション)の購入数です。
|
| Action (SKAN) |
これは、キャンペーン目標に対して選択されたSKAdNetwork帰属(アトリビューション)のすべてのイベントの合計です。アプリ内イベント用に最適化されたキャンペーンの場合、これは、アプリ内イベントの最適化ゴールに対するSKAdNetwork帰属(アトリビューション)のすべてのターゲットイベントの合計です。ROASに最適化されたキャンペーンの場合、これは、SKAdNetwork帰属(アトリビューション)の購入数です。
|
| CTR |
これは、クリックにつながったインプレッションの割合です。 |
| IPM (MMP) |
これは、広告インプレッション1,000回あたりのMMP帰属(アトリビューション)のインストール数の合計です。これは、i2i(インストールへのインプレッション数)比率に似ています。数字が大きいほど、パフォーマンスが優れていることを示します。
|
| IPM (SKAN) |
これは、広告インプレッション1,000回あたりのSKAdNetwork帰属(アトリビューション)のインストール数の合計です。これは、i2i(インストールへのインプレッション数)比率に似ています。数字が大きいほど、パフォーマンスが優れていることを示します。
|
| CPC |
これは、クリックあたりのコストです。 |
| CPI (MMP) |
これは、インストールあたりのMMP帰属(アトリビューション)のコストです。
|
| CPI (SKAN) |
これは、インストールあたりのSKAdNetwork帰属(アトリビューション)のコストです。
|
| CPA (MMP) |
これは、アプリ内イベントの最適化ゴールに対して選択されたイベントあたりのMMP帰属(アトリビューション)のコストです。
|
| CPA (SKAN) |
これは、アプリ内イベントの最適化ゴールに対して選択されたイベントあたりのSKAdNetwork帰属(アトリビューション)のコストです。
|
| Revenue (SKAN) |
Moloco Adsに登録された各コンバージョン値の平均レベニューに基づいて計算された、SKAdNetwork帰属(アトリビューション)のレベニューの合計です。
|
| Revenue D1-D2 |
これは、最初のSKAdNetworkポストバックデータからのレベニュー指標です。
|
| Revenue D3-D7 |
これは、2番目のSKAdNetworkポストバックデータからのレベニュー指標です。
|
| Revenue D8-D35 |
これは、3番目のSKAdNetworkポストバックデータからのレベニュー指標です。
|
| Total event count |
これは、すべてのSKAdNetworkポストバックデータに記録されたすべてのイベントの合計です。
|
| Event count D1-D2 |
これは、最初のSKAdNetworkポストバックデータに記録されたイベント数です。
|
| Event count D3-D7 |
これは、2番目のSKAdNetworkポストバックデータに記録されたイベント数です。
|
| Event count D8-D35 |
これは、3番目のSKAdNetworkポストバックデータに記録されたイベント数です。
|
| Coarse conversion value - high |
これは、粗いコンバージョン値「高」にあるSKAdNetworkポストバック数です。
|
| Coarse conversion value - medium |
これは、粗いコンバージョン値「中」にあるSKAdNetworkポストバック数です。
|
| Coarse conversion value - low |
これは、粗いコンバージョン値「低」にあるSKAdNetworkポストバック数です。
|
| Conversion Value Ratio |
これは、コンバージョン値を含む、受信したすべてのポストバックの割合です。 |
| Conversion Value:None |
これは、コンバージョン値を含まないSKAdNetworkポストバック数です。 |
| Conversion Value:0-63 |
これは、各コンバージョン値に対するSKAdNetworkポストバック数です。 |
|
クリエイティブ分析
クリエイティブ分析を実行して、キャンペーン、クリエイティブグループ、クリエイティブごとのパフォーマンスから洞察を得ることができます。ホイールアイコンをクリックすると、表示する日付範囲、レベル、指標、データに適用するフィルターを更新できます。
| 項目 |
説明 |
| Date range |
-
Overall:このオプションでは、指定期間中のすべてのキャンペーンのすべての指標が表示されます。結果は、降順の使用金額で表示されます。
-
Daily:このオプションでは、各キャンペーンのすべての指標の日次内訳が表示されます。結果は、降順の日付と使用金額で表示されます。
|
| Levels |
以下のレベルでデータを表示できます。
| 項目 |
説明 |
| Campaign |
これは、キャンペーンの名前とIDです。 |
| Campaign Type |
これは、キャンペーンタイプです。利用可能なキャンペーンタイプは、以下の通りです。
|
| Country |
これは、3桁の国番号です。利用可能なすべての国コードについては、このリストをご覧ください。 |
| Location |
これは、キャンペーンが対象としている特定の地域または州です。
重要: 現在、このフィールドは、米国、カナダ、およびインドの一部を対象としているキャンペーンのみ利用可能です。
|
| LAT Target |
キャンペーンがLAT有効デバイスをターゲットにしているかどうかを示します。Onは、キャンペーンがLAT有効デバイスをターゲットにしていることを示します。Offは、キャンペーンがLAT無効デバイスをターゲットにしていることを示します。 |
| OS |
これは、OSタイプです。利用可能なOSタイプは、以下の通りです。
|
| Creative Group |
これは、クリエイティブグループの名前とIDです。 |
| Creative |
これは、クリエイティブの名前です。 |
| Creative Type |
これは、クリエイティブタイプです。利用可能なクリエイティブタイプは、以下の通りです。
- IMAGE:静止画のバナー
- NATIVE_IMAGE:ネイティブ静止画
- NATIVE_VIDEO:ネイティブ動画
- VIDEO:動画
|
| Inventory Traffic |
モバイルアプリのトラフィック、またはモバイルWebのトラフィックのいずれかを示します。APPは、モバイルアプリのトラフィックを示し、WEBは、モバイルWebのトラフィックを示します。
|
| Creative Size |
これは、クリエイティブのサイズです。
例)1080x1920
|
| Video Duration |
これは、動画クリエイティブの長さです。
例)30s
|
| Video End Card Type |
これは、動画クリエイティブのエンドカードタイプです。
例)インタラクティブエンドカード
|
|
| Metrics |
| 項目 |
説明 |
| Date |
これは、指標が記録された日です。タイムゾーンは、アドアカウントのタイムゾーンと同じです。
[Daily] が日付範囲の場合、この指標はデフォルトで含まれているので、削除できません。
|
| Impression |
これは、インプレッション数の合計です。 |
| Click |
これは、クリック数の合計です。 |
| Install |
これは、インストール数の合計です。 |
| Action |
これは、キャンペーン目標に対して選択したイベントが発生した回数です。アプリ内イベントに最適化されたキャンペーンの場合、これはアプリ内イベント最適化ゴールのターゲットイベントすべての合計です。ROASに最適化されたキャンペーンの場合、これは購入された数です。 |
| Conversion |
これは、キャンペーンのコンバージョン指標として選択したイベントが記録された回数です。 |
| Spend |
これは、広告費の総額です。 |
| CTR |
これは、クリックにつながったインプレッションの割合です。 |
| IPM |
これは、広告インプレッション1,000回あたりのMMP帰属(アトリビューション)のインストール数の合計です。これは、i2i(インストールへのインプレッション数)比率に似ています。数字が大きいほど、パフォーマンスが優れていることを示します。
|
| CPC |
これは、クリックあたりのコストです。 |
| CPI |
これは、インストールあたりのコストです。
|
| CPA |
これは、アクションイベントあたりのコストです。
|
| Cost per Conversion |
これは、コンバージョンイベントあたりのコストです。 |
| Engaged View |
指定した日付範囲のエンゲージビュー数の合計です。 |
| VTR |
最初から最後まで動画広告を観たユーザーの割合です。完全視聴数をインプレッション数で割って計算します。 |
| CPCV |
完全視聴1回あたり広告コストです。 |
| 1Q (25%) View |
動画広告を25%視聴したユーザーのインプレッション数です。
|
| 2Q (50%) View |
動画広告を50%視聴したユーザーのインプレッション数です。
|
| 3Q (75%) View |
動画広告を75%視聴したユーザーのインプレッション数です。
|
| Completed View |
動画広告を最初から最後まで完全に視聴したユーザーのインプレッション数です。
|
| D1/D3/D7/D14/D30 Purchase |
指定した日付範囲にMoloco実行キャンペーンにエンゲージメントしたユーザーの合計購入回数です。エンゲージメントの初日から連続で1日、3日間、7日間、14日間、または30日間の累計です。
指定した日付範囲が2023年12月1日~2023年12月4日で、ある1人のユーザーが最初にMoloco実行キャンペーンにエンゲージメントした日が2023年12月1日だとします。2023年12月1日~2023年12月3日のこのユーザーによる購入数がD3購入数にカウントされ、2023年12月1日~2023年12月7日のこのユーザーによる購入数がD7購入数にカウントされます。
|
| D1/D3/D7/D14/D30 Purchaser |
指定した日付範囲にMoloco実行キャンペーンにエンゲージメントし、その後購入を行ったユーザー数の合計です。エンゲージメントの初日から連続で1日、3日間、7日間、14日間、または30日間の累計です。
指定した日付範囲が2023年12月1日~2023年12月4日で、ある1人のユーザーが最初にMoloco実行キャンペーンにエンゲージメントした日が2023年12月1日だとします。2023年12月1日~2023年12月3日にこのユーザーが何らかの購入を行うとD3購入ユーザー数にカウントされ、2023年12月1日~2023年12月7日にこのユーザーが何らかの購入を行うとD7購入ユーザー数にカウントされます。
|
| D1/D3/D7/D14/D30 Revenue |
指定した日付範囲にMoloco実行キャンペーンにエンゲージメントしたユーザーから得られたレベニューの合計です。エンゲージメントの初日から連続で1日、3日間、7日間、14日間、または30日間の累計です。
指定した日付範囲が2023年12月1日~2023年12月4日で、ある1人のユーザーが最初にMoloco実行キャンペーンにエンゲージメントした日が2023年12月1日だとします。2023年12月1日~2023年12月3日にこのユーザーから得られたレベニューがD3レベニューにカウントされ、2023年12月1日~2023年12月7日にこのユーザーから得られたレベニューがD7レベニューにカウントされます。
|
| D1/D3/D7/D14/D30 ROAS |
指定した日付範囲にMoloco実行キャンペーンにエンゲージメントしたユーザーの購入イベントから得られたレベニューを示す、広告の費用対効果(ROAS)です。エンゲージメントの初日から連続で1日、3日間、7日間、14日間、または30日間の累計です。
指定した日付範囲が2023年12月1日~2023年12月4日で、ある1人のユーザーが最初にMoloco実行キャンペーンにエンゲージメントした日が2023年12月1日だとします。2023年12月1日~2023年12月3日にこのユーザーから得られたROASがD3 ROASにカウントされ、2023年12月1日~2023年12月7日にこのユーザーから得られたROASがD7 ROASにカウントされます。
ROASの金額は、レベニューを広告費用で割り、100を掛けて計算されます。表示される数値はパーセントです。
|
| D1/D3/D7/D14/D30 Action |
指定した日付範囲にMoloco実行キャンペーンにエンゲージメントしたユーザーが、キャンペーン目標として指定されたアクションを実行した合計回数です。エンゲージメントの初日から連続で1日、3日間、7日間、14日間、または30日間の累計です。アプリ内イベントに最適化されたキャンペーンの場合、アクションはアプリ内イベント最適化ゴールのターゲットイベントになります。ROASに最適化されたキャンペーンの場合、アクションは購入イベントになります。
指定した日付範囲が2023年12月1日~2023年12月4日で、ある1人のユーザーが最初にMoloco実行キャンペーンにエンゲージメントした日が2023年12月1日だとします。2023年12月1日~2023年12月3日にこのユーザーが実行したアクション数はD3アクション数にカウントされ、2023年12月1日~2023年12月7日にこのユーザーが実行したアクション数はD7アクション数にカウントされます。
|
| D1/D3/D7/D14/D30 CPA |
指定した日付範囲にMoloco実行キャンペーンにエンゲージメントしたユーザーの、アクションイベントあたりのコストです。エンゲージメントの初日から連続で1日、3日間、7日間、14日間、または30日間の累計です。
指定した日付範囲が2023年12月1日~2023年12月4日で、ある1人のユーザーが最初にMoloco実行キャンペーンにエンゲージメントした日が2023年12月1日だとします。2023年12月1日~2023年12月3日のこのユーザーを対象としたCPAがD3 CPAにカウントされ、2023年12月1日~2023年12月7日のこのユーザーを対象としたCPAがD7 CPAにカウントされます。
|
| D1/D3/D7/D14/D30 Retention |
指定した日付範囲にMoloco実行キャンペーンにエンゲージメントし、最初のインストール後の1日、3日、7日、14日、または30日の間にインストール以外のコンバージョンアクションを実行したユーザーの数です。
たとえば、8月14日のD7リテンションは、8月14日に行われたインストール以降の、8月21日時点におけるインストール以外のコンバージョンアクションの数です。
|
重要:分析ダッシュボードでは、キャンペーンとクリエイティブグループのタイトルとIDが結合していますが、CSVファイルではタイトルとIDが別のフィールドとして表示されています。
|
在庫分析
在庫分析を実行して、キャンペーンで使用されている広告在庫に関する洞察を得ることができます。広告在庫は、広告が表示されるパブリッシャーのアプリです。
| 項目 |
説明 |
| Date range |
-
Overall:このオプションでは、指定期間中のすべてのキャンペーンのすべての指標が表示されます。結果は、降順の使用金額で表示されます。
-
Daily:このオプションでは、各キャンペーンのすべての指標の日次内訳が表示されます。結果は、降順の日付と使用金額で表示されます。
|
| Levels |
以下のレベルでデータを表示できます。
| 項目 |
説明 |
| Campaign |
これは、キャンペーンの名前とIDです。 |
| Campaign Type |
これは、キャンペーンタイプです。利用可能なキャンペーンタイプは、以下の通りです。
|
| Country |
これは、3桁の国番号です。利用可能なすべての国コードについては、このリストをご覧ください。 |
| Location |
これは、キャンペーンが対象としている特定の地域または州です。
重要: 現在、このフィールドは、米国、カナダ、およびインドの一部を対象としているキャンペーンのみ利用可能です。
|
| LAT Target |
キャンペーンがLAT有効デバイスをターゲットにしているかどうかを示します。Onは、キャンペーンがLAT有効デバイスをターゲットにしていることを示します。Offは、キャンペーンがLAT無効デバイスをターゲットにしていることを示します。 |
| OS |
これは、OSタイプです。利用可能なOSタイプは、以下の通りです。
|
| Inventory - App Bundle |
これは、広告が表示されたアプリのIDです。これは、アプリのGoogle Play Store IDおよびApple App Store IDと同じです。モバイルWebのトラフィックを伴うキャンペーンの場合、サイトのドメイン情報も含まれます。
どのアプリが広告を表示しているかを確認するには、以下の通り、ストアURLにアプリバンドルIDを追加します。
- Google Play Store:
https://play.google.com/store/apps/details?id=xxxxxx
-
Apple App Store:
https://apps.apple.com/app/idxxxxxxx
注意:ターゲットを作成して、任意のアプリバンドルIDを分析に含めたり、分析から除外したりできます。ターゲットの作成方法は、このガイドをご覧ください。
|
| Inventory - App Title |
これは、広告在庫を提供するアプリまたはパブリッシャーの名前です。アプリのタイトルは、Google Play StoreおよびApple App Storeに表示されているアプリの名前です。 |
| Inventory Traffic |
モバイルアプリのトラフィック、またはモバイルWebのトラフィックのいずれかを示します。APPは、モバイルアプリのトラフィックを示し、WEBは、モバイルWebのトラフィックを示します。
|
|
| Metrics |
| 項目 |
説明 |
| Date |
これは、指標が記録された日です。タイムゾーンは、アドアカウントのタイムゾーンと同じです。
[Daily] が日付範囲の場合、この指標はデフォルトで含まれているので、削除できません。
|
| Impression |
これは、インプレッション数の合計です。 |
| Click |
これは、クリック数の合計です。 |
| Install |
これは、インストール数の合計です。 |
| Action |
これは、キャンペーン目標に対して選択したイベントが発生した回数です。アプリ内イベントに最適化されたキャンペーンの場合、これはアプリ内イベント最適化ゴールのターゲットイベントすべての合計です。ROASに最適化されたキャンペーンの場合、これは購入された数です。 |
| Conversion |
これは、キャンペーンのコンバージョン指標として選択したイベントが記録された回数です。 |
| Spend |
これは、広告費の総額です。 |
| CTR |
これは、クリックにつながったインプレッションの割合です。 |
| IPM |
これは、広告インプレッション1,000回あたりのMMP帰属(アトリビューション)のインストール数の合計です。これは、i2i(インストールへのインプレッション数)比率に似ています。数字が大きいほど、パフォーマンスが優れていることを示します。
|
| CPC |
これは、クリックあたりのコストです。 |
| CPI |
これは、インストールあたりのコストです。 |
| CPA |
これは、アクションイベントあたりのコストです。 |
| Cost per Conversion |
これは、コンバージョンイベントあたりのコストです。 |
| D1/D3/D7/D30 Purchase |
指定した日付範囲にMoloco実行キャンペーンにエンゲージメントしたユーザーの合計購入回数です。エンゲージメントの初日から連続で1日、3日間、7日間、または30日間の累計です。
指定した日付範囲が2023年12月1日~2023年12月4日で、ある1人のユーザーが最初にMoloco実行キャンペーンにエンゲージメントした日が2023年12月1日だとします。2023年12月1日~2023年12月3日のこのユーザーによる購入数がD3購入数にカウントされ、2023年12月1日~2023年12月7日のこのユーザーによる購入数がD7購入数にカウントされます。
|
| D1/D3/D7/D30 Purchaser |
指定した日付範囲にMoloco実行キャンペーンにエンゲージメントし、その後購入を行ったユーザー数の合計です。エンゲージメントの初日から連続で1日、3日間、7日間、または30日間の累計です。
指定した日付範囲が2023年12月1日~2023年12月4日で、ある1人のユーザーが最初にMoloco実行キャンペーンにエンゲージメントした日が2023年12月1日だとします。2023年12月1日~2023年12月3日にこのユーザーが何らかの購入を行うとD3購入ユーザー数にカウントされ、2023年12月1日~2023年12月7日にこのユーザーが何らかの購入を行うとD7購入ユーザー数にカウントされます。
|
| D1/D3/D7/D30 Revenue |
指定した日付範囲にMoloco実行キャンペーンにエンゲージメントしたユーザーから得られたレベニューの合計です。エンゲージメントの初日から連続で1日、3日間、7日間、または30日間の累計です。
指定した日付範囲が2023年12月1日~2023年12月4日で、ある1人のユーザーが最初にMoloco実行キャンペーンにエンゲージメントした日が2023年12月1日だとします。2023年12月1日~2023年12月3日にこのユーザーから得られたレベニューがD3レベニューにカウントされ、2023年12月1日~2023年12月7日にこのユーザーから得られたレベニューがD7レベニューにカウントされます。
|
| D1/D3/D7/D30 ROAS |
指定した日付範囲にMoloco実行キャンペーンにエンゲージメントしたユーザーの購入イベントから得られたレベニューを示す、広告の費用対効果(ROAS)です。エンゲージメントの初日から連続で1日、3日間、7日間、または30日間の累計です。
指定した日付範囲が2023年12月1日~2023年12月4日で、ある1人のユーザーが最初にMoloco実行キャンペーンにエンゲージメントした日が2023年12月1日だとします。2023年12月1日~2023年12月3日にこのユーザーから得られたROASがD3 ROASにカウントされ、2023年12月1日~2023年12月7日にこのユーザーから得られたROASがD7 ROASにカウントされます。
ROASの金額は、レベニューを広告費用で割り、100を掛けて計算されます。表示される数値はパーセントです。
|
| D1/D3/D7/D14/D30 Action |
指定した日付範囲にMoloco実行キャンペーンにエンゲージメントしたユーザーが、キャンペーン目標として指定されたアクションを実行した合計回数です。エンゲージメントの初日から連続で1日、3日間、7日間、14日間、または30日間の累計です。アプリ内イベントに最適化されたキャンペーンの場合、アクションはアプリ内イベント最適化ゴールのターゲットイベントになります。ROASに最適化されたキャンペーンの場合、アクションは購入イベントになります。
指定した日付範囲が2023年12月1日~2023年12月4日で、ある1人のユーザーが最初にMoloco実行キャンペーンにエンゲージメントした日が2023年12月1日だとします。2023年12月1日~2023年12月3日にこのユーザーが実行したアクション数はD3アクション数にカウントされ、2023年12月1日~2023年12月7日にこのユーザーが実行したアクション数はD7アクション数にカウントされます。
|
| D1/D3/D7/D14/D30 CPA |
指定した日付範囲にMoloco実行キャンペーンにエンゲージメントしたユーザーの、アクションイベントあたりのコストです。エンゲージメントの初日から連続で1日、3日間、7日間、14日間、または30日間の累計です。
指定した日付範囲が2023年12月1日~2023年12月4日で、ある1人のユーザーが最初にMoloco実行キャンペーンにエンゲージメントした日が2023年12月1日だとします。2023年12月1日~2023年12月3日のこのユーザーを対象としたCPAがD3 CPAにカウントされ、2023年12月1日~2023年12月7日のこのユーザーを対象としたCPAがD7 CPAにカウントされます。
|
| D1/D3/D7/D14/D30 Retention |
指定した日付範囲にMoloco実行キャンペーンにエンゲージメントし、最初のインストール後の1日、3日、7日、14日、または30日の間にインストール以外のコンバージョンアクションを実行したユーザーの数です。
たとえば、8月14日のD7リテンションは、8月14日に行われたインストール以降の、8月21日時点におけるインストール以外のコンバージョンアクションの数です。
|
|
エクスチェンジ分析
エクスチェンジ分析を実行して、キャンペーンが依存しているアドエクスチェンジに関する洞察を得ることができます。
| 項目 |
説明 |
| Date range |
-
Overall:このオプションでは、それぞれのアプリのバンドルおよびアプリのタイトルに対して、指定期間中のすべての指標が表示されます。結果は、降順の使用金額で表示されます。
-
Daily:このオプションでは、それぞれのアプリのバンドルおよびアプリのタイトルに対して、すべての指標の日次内訳が表示されます。結果は、降順の日付と使用金額で表示されます。
|
| Levels |
以下のレベルでデータを表示できます。
| 項目 |
説明 |
| Campaign |
これは、キャンペーンの名前とIDです。 |
| Campaign Type |
これは、キャンペーンタイプです。利用可能なキャンペーンタイプは、以下の通りです。
|
| Country |
これは、3桁の国番号です。利用可能なすべての国コードについては、このリストをご覧ください。 |
| Location |
これは、キャンペーンが対象としている特定の地域または州です。
重要: 現在、このフィールドは、米国、カナダ、およびインドの一部を対象としているキャンペーンのみ利用可能です。
|
| LAT Target |
キャンペーンがLAT有効デバイスをターゲットにしているかどうかを示します。Onは、キャンペーンがLAT有効デバイスをターゲットにしていることを示します。Offは、キャンペーンがLAT無効デバイスをターゲットにしていることを示します。 |
| OS |
これは、OSタイプです。利用可能なOSタイプは、以下の通りです。
|
| Exchange |
これは、キャンペーンで使用されているアドエクスチェンジです。アドエクスチェンジがあると、購入者と販売者の広告掲載場所の決定プロセスが容易になります。世界中のアドエクスチェンジには独自の規則と制限があるため、それに応じてクリエイティブ戦略を選択する必要があります。使用しているアドエクスチェンジ固有のガイドラインをご覧ください。
|
| Inventory Traffic |
モバイルアプリのトラフィック、またはモバイルWebのトラフィックのいずれかを示します。APPは、モバイルアプリのトラフィックを示し、WEBは、モバイルWebのトラフィックを示します。
|
|
| Metrics |
| 項目 |
説明 |
| Date |
これは、指標が記録された日です。タイムゾーンは、アドアカウントのタイムゾーンと同じです。
[Daily] が日付範囲の場合、この指標はデフォルトで含まれているので、削除できません。
|
| Impression |
これは、インプレッション数の合計です。 |
| Click |
これは、クリック数の合計です。 |
| Install |
これは、インストール数の合計です。 |
| Action |
これは、キャンペーン目標に対して選択したイベントが発生した回数です。アプリ内イベントに最適化されたキャンペーンの場合、これはアプリ内イベント最適化ゴールのターゲットイベントすべての合計です。ROASに最適化されたキャンペーンの場合、これは購入された数です。 |
| Conversion |
これは、キャンペーンのコンバージョン指標として選択したイベントが記録された回数です。 |
| Spend |
これは、広告費の総額です。 |
| CTR |
これは、クリックにつながったインプレッションの割合です。 |
| IPM |
これは、広告インプレッション1,000回あたりのMMP帰属(アトリビューション)のインストール数の合計です。これは、i2i(インストールへのインプレッション数)比率に似ています。数字が大きいほど、パフォーマンスが優れていることを示します。
|
| CPC |
これは、クリックあたりのコストです。 |
| CPI |
これは、インストールあたりのコストです。 |
| CPA |
これは、アクションイベントあたりのコストです。 |
| Cost per Conversion |
これは、コンバージョンイベントあたりのコストです。 |
| D1/D3/D7/D14/D30 Purchase |
指定した日付範囲にMoloco実行キャンペーンにエンゲージメントしたユーザーの合計購入回数です。エンゲージメントの初日から連続で1日、3日間、7日間、14日間、または30日間の累計です。
指定した日付範囲が2023年12月1日~2023年12月4日で、ある1人のユーザーが最初にMoloco実行キャンペーンにエンゲージメントした日が2023年12月1日だとします。2023年12月1日~2023年12月3日のこのユーザーによる購入数がD3購入数にカウントされ、2023年12月1日~2023年12月7日のこのユーザーによる購入数がD7購入数にカウントされます。
|
| D1/D3/D7/D14/D30 Purchaser |
指定した日付範囲にMoloco実行キャンペーンにエンゲージメントし、その後購入を行ったユーザー数の合計です。エンゲージメントの初日から連続で1日、3日間、7日間、14日間、または30日間の累計です。
指定した日付範囲が2023年12月1日~2023年12月4日で、ある1人のユーザーが最初にMoloco実行キャンペーンにエンゲージメントした日が2023年12月1日だとします。2023年12月1日~2023年12月3日にこのユーザーが何らかの購入を行うとD3購入ユーザー数にカウントされ、2023年12月1日~2023年12月7日にこのユーザーが何らかの購入を行うとD7購入ユーザー数にカウントされます。
|
| D1/D3/D7/D14/D30 Revenue |
指定した日付範囲にMoloco実行キャンペーンにエンゲージメントしたユーザーから得られたレベニューの合計です。エンゲージメントの初日から連続で1日、3日間、7日間、14日間、または30日間の累計です。
指定した日付範囲が2023年12月1日~2023年12月4日で、ある1人のユーザーが最初にMoloco実行キャンペーンにエンゲージメントした日が2023年12月1日だとします。2023年12月1日~2023年12月3日にこのユーザーから得られたレベニューがD3レベニューにカウントされ、2023年12月1日~2023年12月7日にこのユーザーから得られたレベニューがD7レベニューにカウントされます。
|
| D1/D3/D7/D14/D30 ROAS |
指定した日付範囲にMoloco実行キャンペーンにエンゲージメントしたユーザーの購入イベントから得られたレベニューを示す、広告の費用対効果(ROAS)です。エンゲージメントの初日から連続で1日、3日間、7日間、14日間、または30日間の累計です。
指定した日付範囲が2023年12月1日~2023年12月4日で、ある1人のユーザーが最初にMoloco実行キャンペーンにエンゲージメントした日が2023年12月1日だとします。2023年12月1日~2023年12月3日にこのユーザーから得られたROASがD3 ROASにカウントされ、2023年12月1日~2023年12月7日にこのユーザーから得られたROASがD7 ROASにカウントされます。
ROASの金額は、レベニューを広告費用で割り、100を掛けて計算されます。表示される数値はパーセントです。
|
| D1/D3/D7/D14/D30 Action |
指定した日付範囲にMoloco実行キャンペーンにエンゲージメントしたユーザーが、キャンペーン目標として指定されたアクションを実行した合計回数です。エンゲージメントの初日から連続で1日、3日間、7日間、14日間、または30日間の累計です。アプリ内イベントに最適化されたキャンペーンの場合、アクションはアプリ内イベント最適化ゴールのターゲットイベントになります。ROASに最適化されたキャンペーンの場合、アクションは購入イベントになります。
指定した日付範囲が2023年12月1日~2023年12月4日で、ある1人のユーザーが最初にMoloco実行キャンペーンにエンゲージメントした日が2023年12月1日だとします。2023年12月1日~2023年12月3日にこのユーザーが実行したアクション数はD3アクション数にカウントされ、2023年12月1日~2023年12月7日にこのユーザーが実行したアクション数はD7アクション数にカウントされます。
|
| D1/D3/D7/D14/D30 CPA |
指定した日付範囲にMoloco実行キャンペーンにエンゲージメントしたユーザーの、アクションイベントあたりのコストです。エンゲージメントの初日から連続で1日、3日間、7日間、14日間、または30日間の累計です。
指定した日付範囲が2023年12月1日~2023年12月4日で、ある1人のユーザーが最初にMoloco実行キャンペーンにエンゲージメントした日が2023年12月1日だとします。2023年12月1日~2023年12月3日のこのユーザーを対象としたCPAがD3 CPAにカウントされ、2023年12月1日~2023年12月7日のこのユーザーを対象としたCPAがD7 CPAにカウントされます。
|
| D1/D3/D7/D14/D30 Retention |
指定した日付範囲にMoloco実行キャンペーンにエンゲージメントし、最初のインストール後の1日、3日、7日、14日、または30日の間にインストール以外のコンバージョンアクションを実行したユーザーの数です。
たとえば、8月14日のD7リテンションは、8月14日に行われたインストール以降の、8月21日時点におけるインストール以外のコンバージョンアクションの数です。
|
|
コホート分析
コホート分析を使用すると、指定期間にわたって共通の特性に基づいてユーザーをグループ化することで、ユーザーの行動を追跡できます。たとえば、UAキャンペーン(新規インストールキャンペーン)を実行している場合、コホートは、指定期間中にアプリをインストールしたユーザーのグループになります。キャンペーンのコホート分析では、アプリをインストールしたユーザーのうち何人が最終的に購入に至ったかが、時系列でわかります。
コホートROAS分析
UAキャンペーン(新規インストールキャンペーン)やREキャンペーン(リエンゲージメントキャンペーン)のコホートROAS分析を実行して、各キャンペーンのROASに関するデータを取得することができます。この分析は、MMPポストバックからキャンペーンのレベニューデータを当社が受け取っている場合にのみ実行できます。
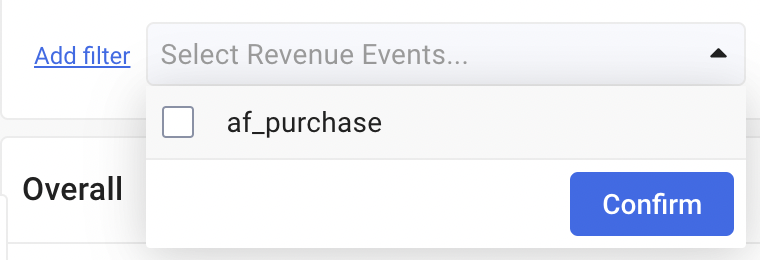
注意:複数のレベニューイベントがある場合は、データフィルターを使用して、基準を満たすイベントのみを選択して検索しましょう。
|
項目
|
説明 |
| Date range |
-
Overall:選択した期間全体で獲得またはリエンゲージメントしたユーザーの全体的なROASを計算します。
-
Daily:選択した期間中に獲得またはリエンゲージメントしたユーザーの日次ROASを計算します。
-
Weekly:選択した期間中に獲得またはリエンゲージメントしたユーザーの週次ROASを計算します。
|
| Metrics |
| 項目 |
説明 |
| Date |
これは、指標が記録された日です。タイムゾーンは、アドアカウントのタイムゾーンと同じです。 |
| Week |
これは、月曜日を各週の最初の日として、指標が記録された週です。タイムゾーンは、アドアカウントのタイムゾーンと同じです。 |
| Campaign |
これは、キャンペーンの名前とIDです。 |
| Country |
これは、3桁の国番号です。利用可能なすべての国コードについては、このリストをご覧ください。 |
| LAT Target |
キャンペーンがLAT有効デバイスをターゲットにしているかどうかを示します。Onは、キャンペーンがLAT有効デバイスをターゲットにしていることを示します。Offは、キャンペーンがLAT無効デバイスをターゲットにしていることを示します。 |
| OS |
これは、OSタイプです。利用可能なOSタイプは、以下の通りです。
|
| Inventory Traffic |
モバイルアプリのトラフィック、またはモバイルWebのトラフィックのいずれかを示します。APPは、モバイルアプリのトラフィックを示し、WEBは、モバイルWebのトラフィックを示します。
|
| Spend |
これは、広告費の総額です。 |
| Install |
これは、インストール数の合計で、アプリインストールのコホートグループのサイズでもあります。 |
| Re-engagement |
これは、リエンゲージメントされたクリック数の合計で、リエンゲージメントユーザーのコホートグループのサイズでもあります。 |
| D1/D3/D7/D30 Purchase |
指定した日付範囲にMoloco実行キャンペーンにエンゲージメントしたユーザーの合計購入回数です。エンゲージメントの初日から連続で1日、3日間、7日間、または30日間の累計です。
指定した日付範囲が2023年12月1日~2023年12月4日で、ある1人のユーザーが最初にMoloco実行キャンペーンにエンゲージメントした日が2023年12月1日だとします。2023年12月1日~2023年12月3日のこのユーザーによる購入数がD3購入数にカウントされ、2023年12月1日~2023年12月7日のこのユーザーによる購入数がD7購入数にカウントされます。
|
| D1/D3/D7/D30 Purchaser |
指定した日付範囲にMoloco実行キャンペーンにエンゲージメントし、その後購入を行ったユーザー数の合計です。エンゲージメントの初日から連続で1日、3日間、7日間、または30日間の累計です。
指定した日付範囲が2023年12月1日~2023年12月4日で、ある1人のユーザーが最初にMoloco実行キャンペーンにエンゲージメントした日が2023年12月1日だとします。2023年12月1日~2023年12月3日にこのユーザーが何らかの購入を行うとD3購入ユーザー数にカウントされ、2023年12月1日~2023年12月7日にこのユーザーが何らかの購入を行うとD7購入ユーザー数にカウントされます。
|
| D1/D3/D7/D30 Revenue |
指定した日付範囲にMoloco実行キャンペーンにエンゲージメントしたユーザーから得られたレベニューの合計です。エンゲージメントの初日から連続で1日、3日間、7日間、または30日間の累計です。
指定した日付範囲が2023年12月1日~2023年12月4日で、ある1人のユーザーが最初にMoloco実行キャンペーンにエンゲージメントした日が2023年12月1日だとします。2023年12月1日~2023年12月3日にこのユーザーから得られたレベニューがD3レベニューにカウントされ、2023年12月1日~2023年12月7日にこのユーザーから得られたレベニューがD7レベニューにカウントされます。
|
| D1/D3/D7/D30 ROAS |
指定した日付範囲にMoloco実行キャンペーンにエンゲージメントしたユーザーの購入イベントから得られたレベニューを示す、広告の費用対効果(ROAS)です。エンゲージメントの初日から連続で1日、3日間、7日間、または30日間の累計です。
指定した日付範囲が2023年12月1日~2023年12月4日で、ある1人のユーザーが最初にMoloco実行キャンペーンにエンゲージメントした日が2023年12月1日だとします。2023年12月1日~2023年12月3日にこのユーザーから得られたROASがD3レベニューにカウントされ、2023年12月1日~2023年12月7日にこのユーザーから得られたROASがD7レベニューにカウントされます。
ROASの金額は、レベニューを広告費用で割り、100を掛けて計算されます。表示される数値はパーセントです。
|
|
コホートアクション分析
コホートアクション分析を実行して、各キャンペーンのアクション(キャンペーン最適化ゴールに対して選択されたイベント)の指標を取得できます。この分析は、アプリ内イベントに最適化されたキャンペーンに対してのみ実行できます。
| 項目 |
説明 |
| Date range |
-
Overall:キャンペーン最適化ゴールに対して選択されたイベントの総数と、選択された期間全体で獲得またはリエンゲージメントしたユーザーのCPAを計算します。
-
Daily:キャンペーン最適化ゴールに対して選択された日次イベント数と、選択された期間中に獲得またはリエンゲージメントしたユーザーのCPAを計算します。
-
Weekly:キャンペーン最適化ゴールに対して選択された週次イベント数と、選択された期間中に獲得またはリエンゲージメントしたユーザーのCPAを計算します。
|
| Metrics |
| 項目 |
説明 |
| Date |
これは、指標が記録された日です。タイムゾーンは、アドアカウントのタイムゾーンと同じです。 |
| Week |
これは、月曜日を各週の最初の日として、指標が記録された週です。タイムゾーンは、アドアカウントのタイムゾーンと同じです。 |
| Campaign |
これは、キャンペーンの名前とIDです。 |
| LAT Target |
キャンペーンがLAT有効デバイスをターゲットにしているかどうかを示します。Onは、キャンペーンがLAT有効デバイスをターゲットにしていることを示します。Offは、キャンペーンがLAT無効デバイスをターゲットにしていることを示します。 |
| OS |
これは、OSタイプです。利用可能なOSタイプは、以下の通りです。
|
| Inventory Traffic |
モバイルアプリのトラフィック、またはモバイルWebのトラフィックのいずれかを示します。APPは、モバイルアプリのトラフィックを示し、WEBは、モバイルWebのトラフィックを示します。
|
| Spend |
これは、広告費の総額です。 |
| Install |
これは、インストール数の合計で、アプリインストールのコホートグループにおけるユーザー数でもあります。 |
| Re-engagement |
これは、リエンゲージメントされたクリック数の合計で、リエンゲージメントユーザーのコホートグループにおけるユーザー数でもあります。 |
| D1/D3/D7/D30 Action |
指定した日付範囲にMoloco実行キャンペーンにエンゲージメントしたユーザーが、キャンペーン目標として指定されたアクションを実行した合計回数です。エンゲージメントの初日から連続で1日、3日間、7日間、または30日間の累計です。アプリ内イベントに最適化されたキャンペーンの場合、アクションはアプリ内イベント最適化ゴールのターゲットイベントになります。ROASに最適化されたキャンペーンの場合、アクションは購入イベントになります。
指定した日付範囲が2023年12月1日~2023年12月4日で、ある1人のユーザーが最初にMoloco実行キャンペーンにエンゲージメントした日が2023年12月1日だとします。2023年12月1日~2023年12月3日にこのユーザーが実行したアクション数はD3アクション数にカウントされ、2023年12月1日~2023年12月7日にこのユーザーが実行したアクション数はD7アクション数にカウントされます。
|
| D1/D3/D7/D30 CPA |
指定した日付範囲にMoloco実行キャンペーンにエンゲージメントしたユーザーの、アクションイベントあたりのコストです。エンゲージメントの初日から連続で1日、3日間、7日間、または30日間の累計です。
指定した日付範囲が2023年12月1日~2023年12月4日で、ある1人のユーザーが最初にMoloco実行キャンペーンにエンゲージメントした日が2023年12月1日だとします。2023年12月1日~2023年12月3日のこのユーザーを対象としたCPAがD3 CPAにカウントされ、2023年12月1日~2023年12月7日のこのユーザーを対象としたCPAがD7 CPAにカウントされます。
|
|
よくあるご質問
キャンペーンのROASは、どこで追跡できますか?
Moloco Adsには、キャンペーンの広告費用対効果(ROAS)を追跡できる場所がたくさんあります。たとえば、[Analytics] に移動して、キャンペーンタイプの [Cohort ROAS Analysis] を選択します。詳細は、分析の概要をご覧ください。または、[Home] > [App Home] > [Campaign Home] と移動し、アプリを選択してから指標を追跡するキャンペーンを選択し、[Highlight setting] をクリックして、指定期間にわたって追跡する指標を指定することもできます。ROASに最適化されたキャンペーンの場合、コホート分析のレベニュー指標は、キャンペーン目標として選択されたイベントからのみ、計算されます。他のすべてのキャンペーンタイプでは、コホート分析のレベニュー指標は、MMPポストバックデータに含まれるすべてのレベニュー追跡イベントから計算されます。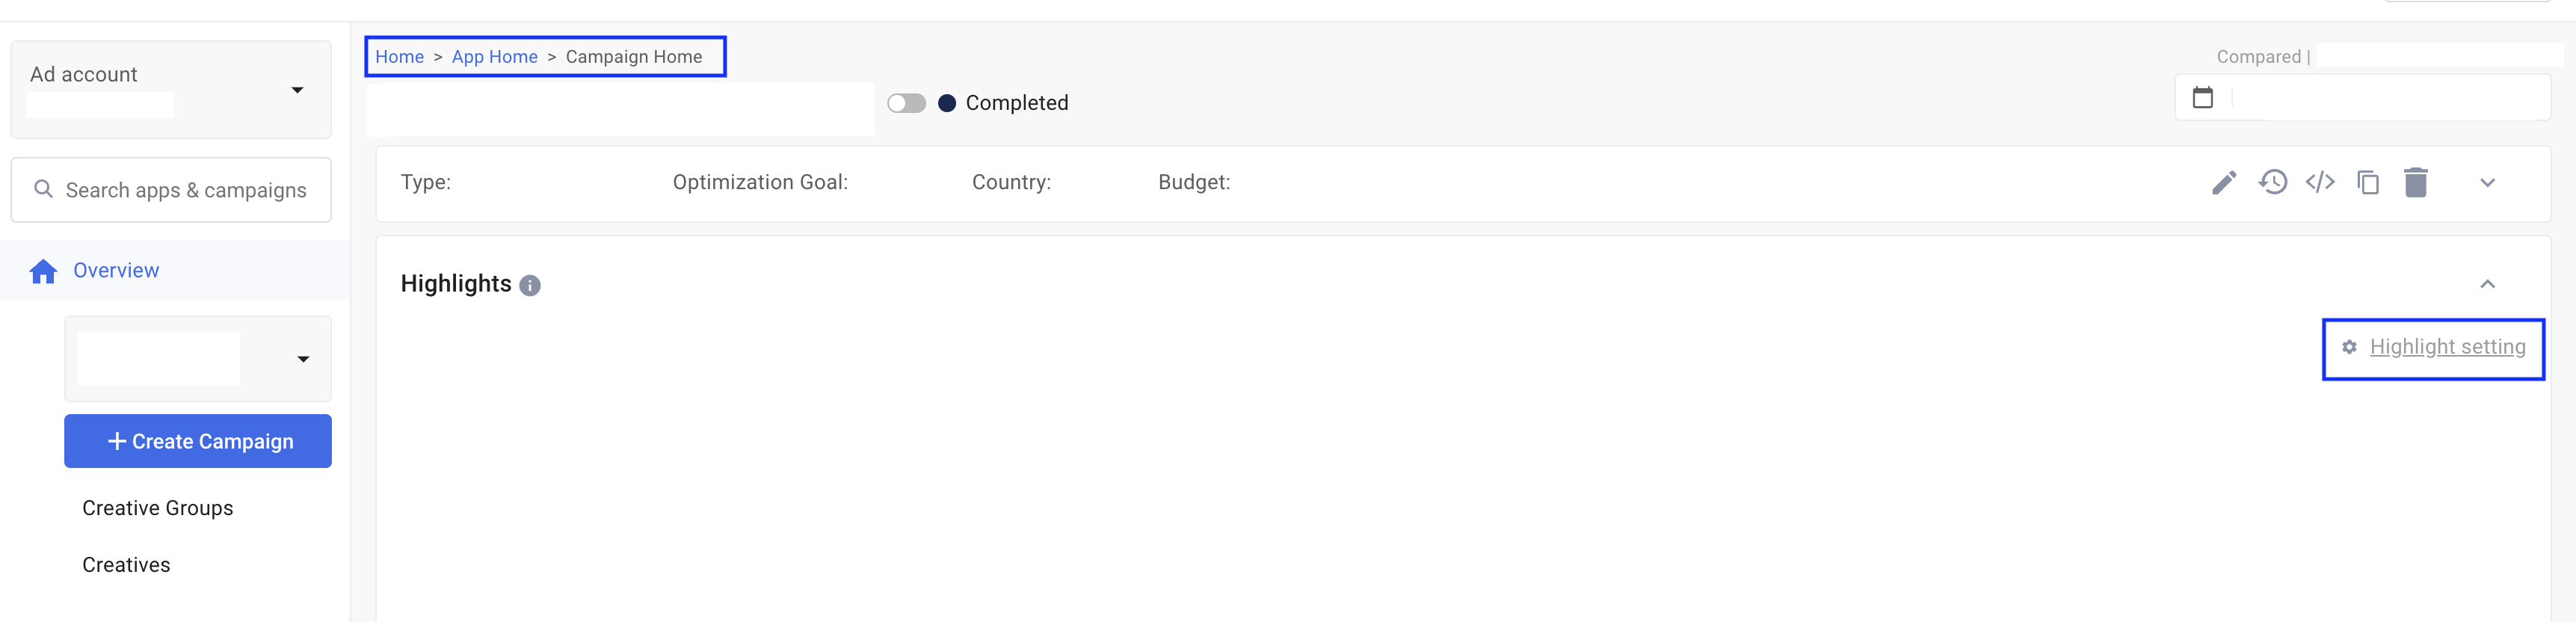
クリエイティブグループ/パブリッシャーレベルのパフォーマンスを見るにはどうすればよいですか?
[Analytics] タブを開きます。クリエイティブグループごとのパフォーマンスは [Creative Analysis] セクションで確認できます。
在庫ごとのパフォーマンスは [Inventory Analysis] で確認できます。複数の変数を使用してレポートを分析するには、[Report] タブに移動します。次に [Columns] をクリックし、[Levels] セクションから必要なフィールド(クリエイティブグループや在庫など)を選択します。
キャンペーンのCPAやActionが表示されないのはなぜですか?
[CPA] と [Action] の指標は、アプリ内イベントの最適化ゴールが設定されたキャンペーンにのみ適用されます。
アプリ内イベント以外の最適化ゴールが設定されたキャンペーンでは、[Conversion] 指標を利用できます。[Conversion] は、キャンペーンを設定または編集しているときに、[Additional Settings > Conversion Setting] からアプリ内イベントを選択することで設定できます。コンバージョンの設定はキャンペーンの実行中も編集でき、変更前のキャンペーンデータも変更後のイベントデータで更新されます。変更した設定が実際のレポートに反映されるまでには、最大で24時間かかる場合があることに注意してください。
Molocoのキャンペーンデータを分析パートナー/社内分析ツールに転送するにはどうすればよいですか?
連携の方法は2通りあります。
1)Molocoレポートパートナーと連携する:Molocoではレポートパートナーとシームレスに連携できます。詳細な連携ガイドと、サポートされているすべてのパートナーの一覧については、レポートパートナーとの連携に関する記事を参照してください。
2)MolocoレポートAPIを使用する:Molocoの [Analytics] ダッシュボードに加えて、社内分析用のキャンペーンレポートを取得するために使用できるレポートAPIも用意されています。詳細は、レポートAPIの連携の記事をご覧ください。
この記事は役に立ちましたか?
0人中0人がこの記事が役に立ったと言っています
他にご質問がございましたら、リクエストを送信してください